
Quality assessment of MALDI imaging data
| Working Group: | WG Industrial Mathematics |
| Leadership: | Prof. Dr. Dr. h.c. Peter Maaß ((0421) 218-63801, E-Mail: pmaass@math.uni-bremen.de ) |
| Processor: |
Delf Lachmund
Dr. Janina Oetjen Dr. Tobias Boskamp |
| Project partner: | |
| Time period: | since 01.04.2015 |
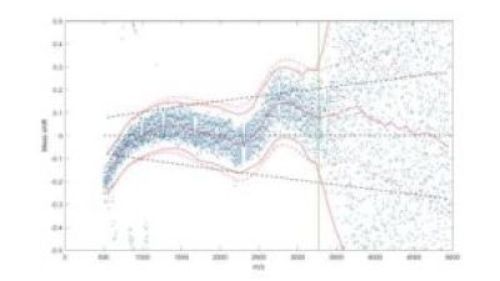
Mass shift profile of a MALDI imaging measurement. Dots mark the deviations from the theoretical peptide model for local maxima of the mean spectrum. The red center line indicates the estimated mass shift, the black dashed lines the expected reference corridor.
With the method of MALDI imaging mass spectrometry spatially resolved spectral data are acquired, which can include several hundred thousand spectra at a spatial resolution of a few micrometers. Each spectrum, in turn, consists of up to 40,000 data points, so that even a single measurement provides a large amount of data.
In addition to the information of interest about the respective concentrations of the substances present in the examined sample, a MALDI imaging data set has a multiplicity of signal disturbances and superpositions, which severely limit the evaluation of the data and their comparability. Due to the complexity of the data and the variety of perturbations that are highly dependent on sample preparation and MALDI measurement, there is currently no feasible, objective, and widely accepted method of assessing the quality of a MALDI imaging data set. However, such a method is essential for optimizing data acquisition and establishing a standard operating procedure (SOP).

Based on the work of former ZeTeM collaborators Theodore Alexandrov and Andrew Palmer, the ZeTeM Bioinformatics Group has developed a methodology for assessing the quality of MALDI imaging data and systematically developing application-specific SOPs for data acquisition. Key elements of this methodology are a) the definition of a fractional factorial design of experiments for carrying out a series of comparison measurements, and b) the use of a linear ANOVA model (Analysis of Variance) for the evaluation of the effects of the various acquisition parameters on the resulting quality. For the quality assessment on the one hand measures of image structure are used, like the measure of chaos developed by Alexandrov and Palmer, and on the other model-based measures, which determine how well important data characteristics agree with a theoretical model.
The second category involves a recently developed method to visualize and quantify mass shifts in MALDI imaging data, which is particularly suitable for a proteomic analysis based on histopathological tissue samples. For this purpose, a large number of unspecific spectral features are extracted from the data and their mass numbers are compared with a simple theoretical model. From the statistical distribution of the deviations, the extent of the mass shifts can be derived quantitatively, which allows for subsequent correction of the data.
Right: Ion images of the same peptide of the myelin basic protein, extracted from eight measurements each from two experimental designs (fixation and digest setup). The colored bars show the values of three different quality measures as deviations from the respective average.