
3D MALDI imaging study of a rat spinal cord injury (SCI)
| Working Group: | WG Industrial Mathematics |
| Leadership: | Prof. Dr. Dr. h.c. Peter Maaß ((0421) 218-63801, E-Mail: pmaass@math.uni-bremen.de ) |
| Processor: |
Dr. Lena Hauberg-Lotte
Leïa Westerheide |
| Project partner: | Prof. Dr. Michel Salzet, PRISM, Université Lille |
| Time period: | since 01.02.2015 |
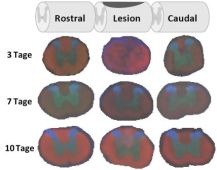
The presentation of m/z values m/z 772 (green), m/z 768 (red) and m/z 756 (blue) represent the most important anatomic regions of the spinal cord, namely the grey and white matter as well as the dorsal horn. It becomes clear that within the lesion site (L) of the spinal cord the structure of lipid distribution is massively interrupted after 3 days and that the anatomic conditions of the spinal cord cannot be identified. However, only after 7 days, a reorganization of the lipid distribution and therefore a regeneration of the spinal cord can be observed.
For some years now, the WG Industrial Mathematics of the ZeTeM cooperates with Prof. Dr. Michel Salzet and Prof. Dr. Isabelle Fournier from the interdisciplinary labor PRISM at University of Lille. This cooperation focuses on the analysis of three dimensional MALDI imaging data. The joint study deals with neuro-immunological questions related to rat spinal cord injury, which allow drawing conclusions to humans. Spinal cord injuries (especially caused by traffic accidents, downfalls or sports) pose due to the frequency and hardness a big social health problem. For these injuries, the extend of the spinal cord lesion is of great importance as spinal cord lesions may lead to complete paraplegia and always comes along with inflammation processes and scarring. New studies could show that starting from the lesion regeneration of the tissue is possible.
These regeneration processes are the object of our 3D MALDI imaging analysis: The distribution of lipids in spinal cord has been analyzed spatially, i.e. in three segments of the spinal cord, as well as temporally, i.e. three, seven and ten days after lesion, with imaging mass spectrometry. A great challenge has been the huge amount of data on the one hand, and the registration of more than 300 tissue sections to a 3D MALDI imaging model on the other hand. Actually, SCiLS Lab from SCiLS, a branch of Bruker Daltonik GmbH (Bremen) is the only commercialized software worldwide, which is able to analyze and visualize such data.
On the mathematical side, numerous algorithms have been used to interpret the 3D MALDI imaging data: First, a standard baseline correction via iterative convolution and TIC (Total Ion Count) normalization was performed. Then the relevant peaks have been detected by orthogonal matching pursuit and segmentation of the data by the bisecting k-means algorithm was conducted. M/z values which are important for the characterization of spatial as well as temporal differences were extracted by correlation analysis. For example m/z values that are co-localized with the grey or white matter of the spinal cord and the position of the lesion were detected. Moreover, the ROC analysis (Receiver Operating Characteristics) leads to a detection of m/z values which discriminate between different times, segments e.g. anatomic regions within the data.
The examination of the spinal cord injury with 3D MALDI imaging has confirmed that the lipid distribution within the lesion region is strongly affected by the injury. Three days after SCI the anatomical structure of the spinal cord has been completely disrupted. Further is has been shown, that regeneration of the spinal cord already starts after seven days, visualized in MALDI imaging by a remarkable reorganization of the lipid distribution within the lesion. Moreover, these results have been supported by immunological methods as well as proteomic analysis, so the basis characterization of the processes after spinal cord lesion was formed. First results have been published successfully, more publications have been submitted.

Graphical representation of m/z values 822.595 (up left) and 844.518 (up right) at three time points after lesion; visualization of m/z value 400,324 at three segments of the spinal cord (R1 = rostral, L = lesion, C1 = caudal) and at three different time points after lesion (3, 7, and 10 days, middle), and the mean spectrum of all MALDI imaging data (down). The lipid with m/z 822.595 is mainly located in the white matter, whereas the lipid with m/z 844.518 . characterizes the grey matter of the spinal cord. The lipid with m/z 400.324 is located in the lesion zone. Evaluation and visualization has been performed with the software SCiLS Lab 2016 from SCiLS, branch of Bruker Daltonik GmbH (Bremen).